[Co-author of this article is Peter A. Morrison, Ph.D., RAND Corporation Senior Demographer (retired) and President, Peter A. Morrison and Associates, Inc. He is an applied demographer based on Nantucket Island, MA. He graduated from Dartmouth College and holds a Ph.D. from Brown University. Email: petermorrison@me.com; website: Peter A. Morrison]
KEY POINTS
Local governing boards in San Juan County’s seasonal resort communities need immediate guidelines for balancing the need to protect their residents’ health and safety while sustaining local economic viability. As the County undertakes to restore economic viability, it must remain alert to any harbingers of an emergent COVID-19 contagious surge so that local communities can implement emergency responses. We offer a simple demographic model for signaling such alerts. These alerts can inform day-by-day decisions about emergency preparedness and triggering pre-authorized mitigation responses. This model can derive useful “yellow” and “red” early warnings from the overall statistical trend in daily reported counts of local “confirmed coronavirus cases” which most health departments now collect. These “early warnings” can equip any local community to detect and react to an impending risk, or to confirm the ongoing absence of risk as previously-imposed restrictions are gradually relaxed.
INTRODUCTION
The San Juan Islands apparently are moored at a “pre-surge” stage of COVID-19 contagious spread. The telltale sign of an emergent surge (sudden explosive growth) is missing. On March 22nd, San Juan County had one confirmed COVID-19 case and by May 28th, it had only 15 cumulative total cases. Whatcom County, by contrast, reported a cumulative total of 48 cases on March 24th and 380 on May 28th.
With a continuing influx of summer visitors, the residents of the San Juan Islands face an increasing risk of a surge in contagious spread. By the time any emergent surge became fully apparent, the prospects for effective early suppression will have narrowed. Intervening just a week or two earlier could be very advantageous in restraining an embryonic surge.
Additional summer visitors increase the effective population of San Juan County by about 52 percent above its year-round resident population count (San Juan Department of Community Development, 2018 Report, Table 4, which can be accessed here.) The 52% summer surge is a gradual procession of different people coming and going. So many different faces from other places almost certainly would amplify the risk of an outbreak, especially on Lopez, Orcas, and San Juan islands which are the destinations of most summer visitors. Like their counterparts elsewhere (e.g., Nantucket, Martha’s Vineyard, and other island seasonal resort communities), the San Juan Islands must balance the need to protect the health and safety of all summer residents while sustaining local economic viability.
Our approach (outlined below) addresses an immediate urgent need: detecting early harbingers of an emergent contagious surge, then acting promptly and forcefully to suppress further outbreak. This approach integrates two elements:
(1) an early-warning alert, signaled by the statistical trend in daily reported counts of local “confirmed coronavirus cases,” presently compiled by San Juan County for the State Department of Health, forwarded on to the Washington State Department of Health and from there to the Johns Hopkins Coronavirus Resource Site; and
(2) a menu of pre-authorized responses, ready for immediate implementation upon any alert.
Akin to warnings that precede an approaching hurricane, this early warning plus response protocol is designed to detect and respond to an impending risk, using readily available data. The “early warning” alert element is calibrated and ready to use now. The “preauthorized response” element must be fleshed out as a spreadsheet of policy actions for re-tightening whatever local restrictions may have been loosened.
HOW EARLY-WARNING ALERTS CAN GUIDE “ADAPTIVE RESPONSE”
We have adapted a traditional demographic model to estimate the near-term relative risk of COVID-19 spread for island communities and other local geographies. This model is well-suited to the “adaptive response” approach to re-opening local economies, whereby policy-makers incrementally loosen and re-tighten restrictions to gradually restore a healthy local economy.
Our transparent projection model plays one key role: It signals a statistically defensible early-warning alert—and, by extension, window of opportunity for response. The model incorporates the “ARIMA” method (Auto Regressive Integrated Moving Average), a standard forecasting tool that is well-suited to San Juan County’s present quiescent stage. Our model (shown below) was deemed adequate by the NCSS Statistical system, the software we used to implement it.

The principal virtue of our model is its minimal appetite for data. A user need only assemble the ordered time-daily total cumulative COVID-19 case count. For this application, we acquired these data from the Johns Hopkins University Coronavirus Resource Center.
The principle limitation of our model is its narrow applicability to the “pre-surge” stage of COVID-19 contagious spread. The advent of any subsequent surge in coming weeks/months would invalidate its underlying assumptions, rendering the model inapplicable thereafter. In short, our model has a proper use and can serve an important purpose for quiescent island resort communities as newcomers arrive from elsewhere.
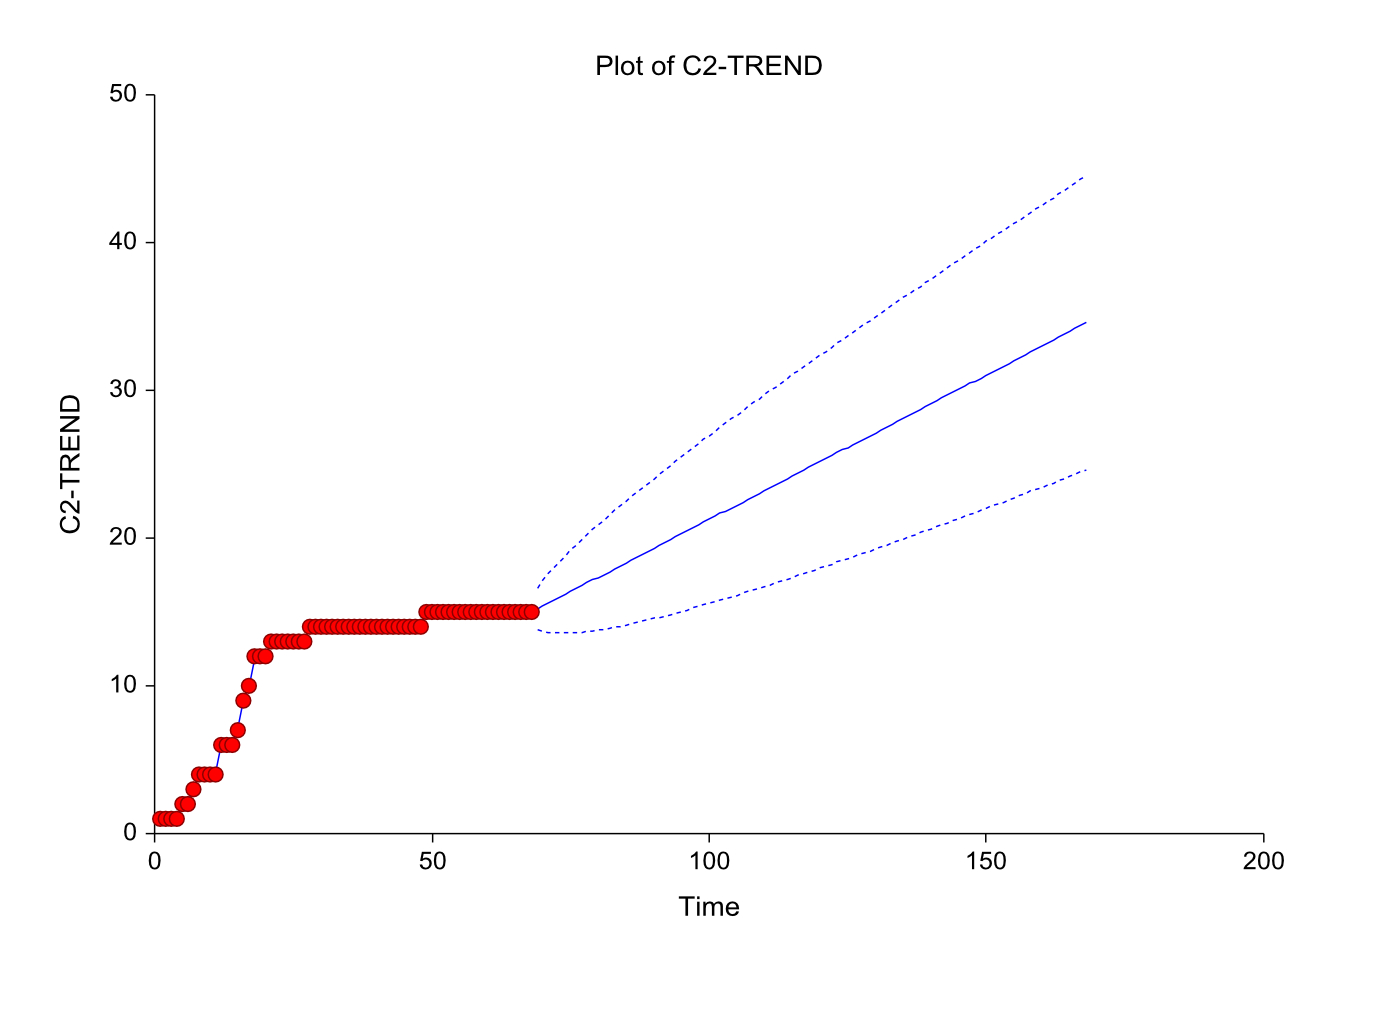
The headline figure above this article displays the actual 68-day time series of the cumulative case count data from March 22nd through May 28th, 2020 (daily red dots). The middle solid line extending on to the right (beyond the red dots) traces projected values from May 29th onward through September 5th. This line represents a plausible “best estimate” of what lies ahead absent any departure from the prevailing quiescence before a summer influx of outsiders. The dashed lines above and below the solid trend line represent the 95% lower and upper prediction limits.
The further ahead we look, of course, the less certain we are about the future. Consistent with that reality, the dashed lines trace a widening cone of uncertainty the further ahead one looks. (One virtue here: our probabilistic model cannot tell a lie!)
TRIGGERING PRE-AUTHORIZED ACTIONS
Another virtue of a probabilistic model: we can judge the limits of the quiescence observed thus far—the continuing absence of any contagious outbreak. The 95% lower and upper prediction limits accompanying the forecast afford an objective basis for triggering actions as observed counts are recorded, day after day (The day your temperature reaches 100.4 degrees, it’s a fever).
Suppose the cumulative case count trends upward over several days, veering toward that upper 95% bound. Any accelerated upward trend would warrant close observation and perhaps triggering a “yellow light” warning alert for preparatory actions. Any trend nearing the upper 95% bound would signal firm evidence of an emerging contagious surge and might trigger a “red light” alert to prompt further immediate actions. In short, each colored alert would serve to activate pre-authorized “tightening” actions (perhaps following earlier incremental “loosening” steps).
FORMULATING PRE-AUTHORIZED ACTION PROTOCOLS
However these objective triggers may be calibrated, their applicability will be to actions that have been pre-authorized. The central aim here is to buy valuable time—even one week—to activate pre-approved “tightening” policies. Those policies must be formulated and pre-approved for implementation at once. By the time a surge becomes apparent, the prospects for effective early intervention will have narrowed. What this calls for is a menu of “Emergency Preparedness” actions (see illustration below).

The May 29th through September 5th projection (day 69 onward) is a baseline “forecast” of what to expect, given the trend in confirmed cumulative cases from March 22nd to May 28th. Starting May 29th, the actual reported daily cumulative number of cases should be tracked alongside the corresponding baseline forecasted number shown.
To illustrate, consider the period from July 16th to 23rd, where the cumulative forecasted count remains at 25 each day from the 16th to the 20th and then increases to 26 on the 21st and stays there through the 23rd. If a new case was confirmed on the 16th, the count would be 26. if two new cases are reported on the 17th, the count would be 28 and if on the 18th and 19th there was one more new case, respectively, the count would be 29 and 30, At this point, the “yellow light” is flashing. If by the 23rd, the reported case count hit or exceeded the forecasted upper limit of 33, then the red light starts flashing.
Ours is not a perfect early-warning system. Persons already infected may remain asymptomatic before becoming sick enough to warrant a test. Virtually all tests are imperfect because they issue both false negatives and false positives. Testing rates could change insofar as one test supersedes another (less accurate) test and because more test per capita are given. There also is a lag between infection and confirmation. Lastly, our system would be vulnerable to misreported or suppressed data, as has occurred in Florida and Georgia. Also, vulnerable to an outbreak are the county’s four assisted living centers or a cottage processing operation, neither of which are likely to be routinely exposed to a surge of summer visitors.
In conclusion, proper application of this model requires reliable data, local area knowledge, and an appreciation of the logic and inherent limitations of this early-warning approach. The model’s principal virtue (a minimal appetite for data) must be balanced by conscious recognition of its inherent limitations (the model is inapplicable once an actual surge commence). As with a traffic signal at a two-way intersection, turning yellow informs decision-making; nothing immediately thereafter should be relied upon.
Once a community has agreed upon the “braking” actions to be taken, it needs only a properly calibrated ARIMA model to forecast the trend in confirmed covid-19 cases relative to the 95% upper prediction limit to implement a suitable “yellow-then-red light” system to prompt immediate action.
Shown here is our actual forecast with 95% prediction limits, the basis for the graph at the top of this article.

Comments by Readers
Wynne Lee
Jun 04, 2020Excellent info and ideas, given that areas of Whatcom County see large increases in transient populations during summer & holidays, including Birch Bay, Lake Whatcom and Lummi Island. I think we should ask our County Council, Exec and city leaders to develop plans to deal with potential outbreaks.
Michael Riordan
Jun 16, 2020Thanks for doing this analysis, David and Peter. As an Orcas Island resident, I’ve been following the Covid-19 outbreaks in San Juan County, as well as in Skagit and Whatcom, and have written about them in these electronic pages, so I am very interested in your results.
One question: What is the assumption behind the slope of the linear rise shown in your graph? There must be something that drives this rise, based on our tourist influx this summer. And it looks like you assume that any such outbreaks will be kept under control, otherwise the solid line would curve rapidly upward, correct?
Finally, are you aware that SJC announced its 16th case yesterday, June 15? It’s due to a new employee hired at Roche Harbor, which claims it is doing testing of its employees.
David A. Swanson
Jun 16, 2020The slight upward trend is driven by the historical data series to which the ARIMA model is fitted. Keep in mind that the trend is meant to be a “forecast” only n the absence of any conditions disrupting the trend driven by the historical series. As such (per our discussion in the article), it serves as a baseline (to include, especially, the upper prediction limit) against which to evaluate the appearance of new cases and determine if any actions are needed.
Michael Riordan
Jun 16, 2020That may not be a good assumption, as the SJC Health Department seems to have the original outbreak, which was due to county residents, well under control and probably had eradicated the virus in the county. The summer cases will likely be due to non-residents coming here from off island carrying the virus, as I believe the 16th case mentioned above was. So you can’t just use historical data to predict the future.
David A. Swanson
Jun 16, 2020GIven that the 16th case is counted as a case to resident of SJC, the new empoyee of the county is now residing in the county (if not, the new employee would not be counted as a SJC “case,” but instead the case would have been counted elsewhere). As such, it is consistent with the historical data used to generate the ARIMA “baseline” found in the ARIMA results. So, these historical data appear to be serving the probabilistic ARIMA “warning system” as intended.
The fact that the title of the article contains “Seasonal Resort Communities” in it should have been a clue that the warning system is aimed at outbreaks stemming from, quoting, in part, your comment, “..non-residents coming here from off island carrying the virus.” Was it not clear to you that this, in fact, is the entire point of the suggested warning system?
Until now I thought the only place in the Salish Sea area that existed under a dome was Edgemoor. Thanks for enlightening me about SJC.
Michael Riordan
Jun 16, 2020This was not a “new employee of the county” from what I’ve heard (facts are scarce because of privacy concerns) but a new employee of Roche Harbor (a private entity) who had been hired from off island, hence more equivalent to a visitor or tourist than a current island resident.